
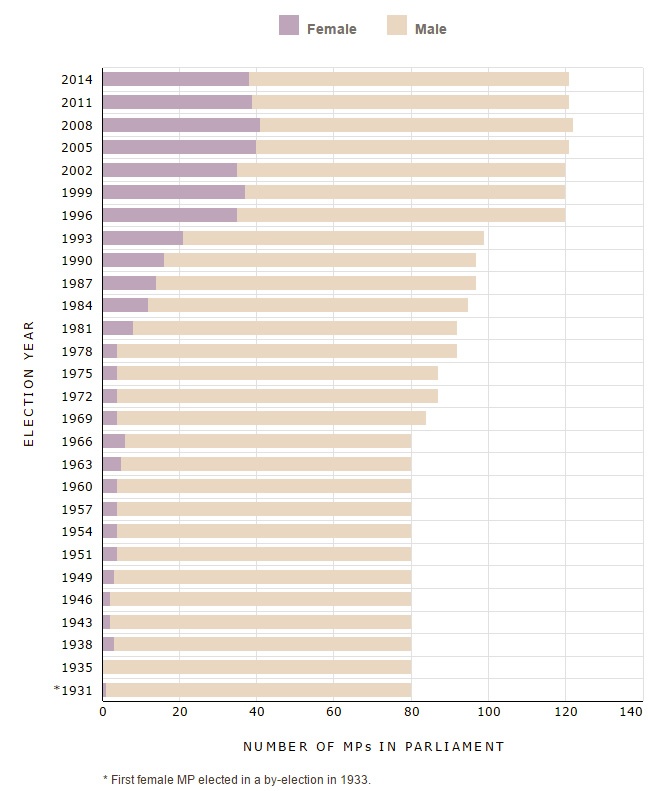
Female Members of Parliament (MPs) compared with the total number of MPs from 1931 to 2014
Table of this data
| Year | Number of female MPs | Total MPs |
|---|---|---|
| 1931–35 | 1 | 80 |
| 1935–38 | 0 | 80 |
| 1938–43 | 3 | 80 |
| 1943–46 | 2 | 80 |
| 1946–49 | 2 | 80 |
| 1949–51 | 3 | 80 |
| 1951–54 | 4 | 80 |
| 1954–57 | 4 | 80 |
| 1957–60 | 4 | 80 |
| 1960–63 | 4 | 80 |
| 1963–66 | 5 | 80 |
| 1966–69 | 6 | 80 |
| 1969–72 | 4 | 84 |
| 1972–75 | 4 | 87 |
| 1975–78 | 4 | 87 |
| 1978–81 | 4 | 92 |
| 1981–84 | 8 | 92 |
| 1984–87 | 12 | 95 |
| 1987–90 | 14 | 97 |
| 1990–93 | 16 | 97 |
| 1993–96 | 21 | 99 |
| 1996–99 | 35 | 120 |
| 1999–2002 | 37 | 120 |
| 2002-2005 | 35 | 120 |
| 2005–2008 | 40 | 121 |
| 2008-2011 | 41 | 122 |
| 2011-2014 | 39 | 121 |
| 2014- | 38 | 121 |
Community contributions