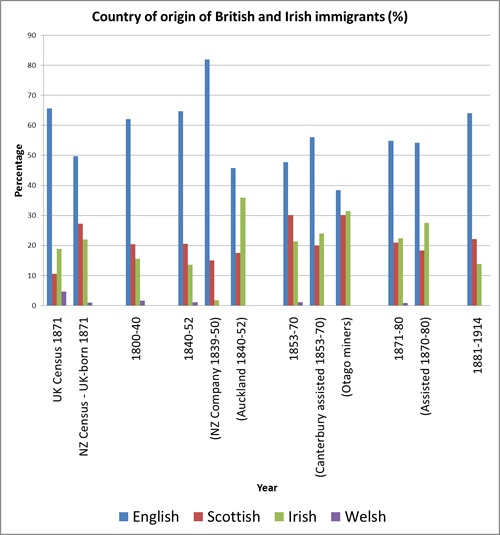
The composition of the inflow from Britain and Ireland was quite different from the composition of the United Kingdom as a whole. By comparison with the distribution of population in the homelands, there were generally fewer English than might be expected and considerably more from Ireland and especially Scotland.
Country of origin of British and Irish immigrants
 |
English | Scottish | Irish | Welsh |
|---|---|---|---|---|
| UK Census 1871 | 65.6% | 10.6% | 18.8% | 4.6% |
| NZ Census – UK-born 1871 | 49.7% | 27.3% | 22% | 1% |
| 1800–40 | 62.1% | 20.4% | 15.6% | 1.6% |
| 1840–52 | 64.7% | 20.6% | 13.6% | 1.1% |
| NZ Company 1839–50 | 82% | 15% | 1.8% | |
| Auckland 1840–52 | 45.8% | 17.6% | 35.9% | |
| 1853–70 | 47.7% | 30.2% | 21.4% | 1.1% |
| Canterbury assisted 1853–70 | 56% | 20% | 24% | |
| Otago miners | 38.4% | 30.1% | 31.5% | |
| 1871–80 | 54.8% | 20.9% | 22.4% | 0.9% |
| Govt Assisted 1871–80 | 54.2% | 18.3% | 27.5% | |
| 1881–1914 | 64.1% | 22.1% | 13.9% | |
These figures and graph suggest:
- Welsh: Throughout the whole period the Welsh were significantly under-represented among New Zealand's immigrants. This may be partly because they were far from the major ports of London and Glasgow.
- English: For the first fifty years of settlement in New Zealand the English were represented about in proportion to their population at home; but they were especially well represented in the New Zealand Company settlements. They were poorly represented in Auckland. During the great period of migration from 1853 to 1880 the English proportions declined. Even Canterbury, a New Zealand Company settlement and a notoriously 'English place', did not assist immigrants from England at the level of their representation in the United Kingdom as a whole. Among the miners the English were especially poorly represented. In the years up to the First World War the numbers of English-born immigrants recovered. [Regional origins of English immigrants]
- Scots: Scotland was a very significant source of New Zealand's immigrants throughout the 19th century, and Scots immigrants were consistently more than double their representation in the United Kingdom itself. Their numerical importance was especially great in the provincial period, and among the mining communities. [Regional origins of Scottish immigrants]
- Irish: The Irish pattern is quite different again. They were under-represented for the first fifty years of settlement — dramatically so among those given free passages by the New Zealand Company. Auckland's population, however, was over one third Irish, some having migrated from Australia, others who had come out with the British Army. Their numbers increased during the provincial era, not only with high numbers among the miners but even among those assisted by Canterbury province. The Irish were also very well represented among those assisted by the New Zealand Government despite contemporary claims that they were not considered desirable. Many Irish came in at this time after nomination by their relatives who were already in New Zealand. Thereafter the numbers of Irish immigrants dropped. The bulk of the Irish community of New Zealand is descended from those who arrived in the twenty years 1860–80 — either as miners in the 1860s or as assisted immigrants of the 1870s. [Regional origins of Irish immigrants]